Since our most recent update briefly touched on using Reports in conjunction with Reminders to help you stay on top of your finances, it's probably a good time to give a more in depth overview of the Reports themselves.
While building the first version of billQ, our mission was to make keeping track of your bills easy. We feel we've made some progress on that front. But one thing we realized was that while keeping track of your bills before they were paid was now much easier, we were still in the dark about where our money went each month after our bills were paid. We wanted to fix this in the new version, so we built Reports.
The goal of Reports is to give you a clear picture of your expenses. It is a quick and easy way for you to see where you're spending money from month-to-month so you can make more informed decisions when developing a budget (or when looking for ways to save).
The Reports page displays your data three ways: by Date, Bill, and Group.
Reports by Date
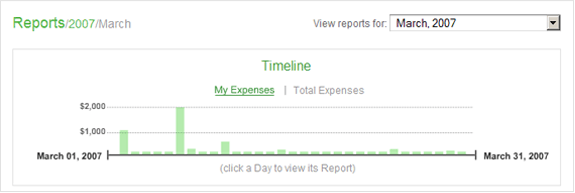
 The first way to view your expense history is by date. On every Report page you will see the Timeline. This timeline shows the number of bills you paid, and the total amount of those expenses for a specific date. Depending on how broad your viewing options are, the dates shown are days, months, or years.
Reports by Bill
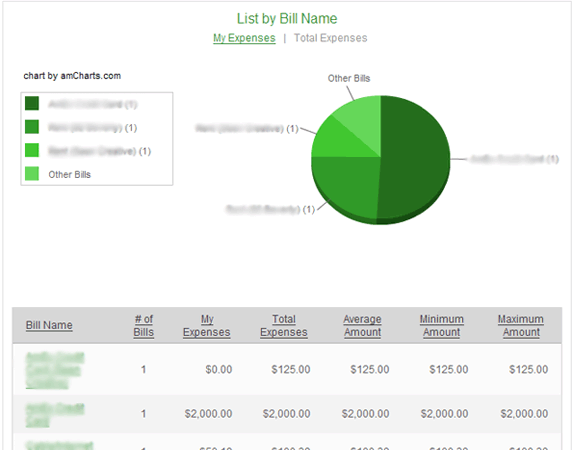
 The second way to view your expense history is by Bill. Each bill has its own history (amount due, the due date, the date paid, etc.). This data comes in very handy if you are looking to track your spending over a long period of time. For example, if you pay a Utilities bill, you can see which months of the year are higher (usually the winter months), and which are lower — helping you prepare your budget.
Reports by Group
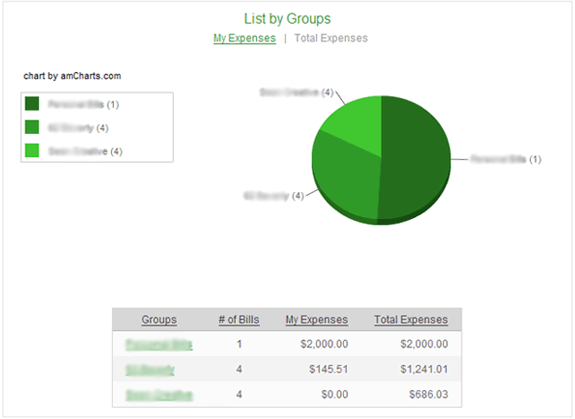
 The last way to view your expense history is by Group. If you have your expenses set up in groups, you can view the data for that group (amount due, due date, date paid, etc.). Again, this is very handy for budgeting as you can see your expense trends over a period of time. You can easily check and see if you should cut back on the Magazine subscriptions or the Credit Card expenses.
Sorting by Viewing Period
 One important thing to note about the reports is that you can control the amount of data displayed for a specific selection by changing the viewing period. This allows you to only view data for certain periods of time (i.e., past 3 months, past month, etc.). It should be mentioned that, billQ Plus users have access to their entire history from the Reports page, while billQ Free users only have access to the past 3 months
Exporting Reports
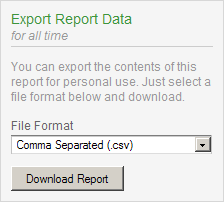
 Finally, you can export your report data to a number of file formats should you want to use it for you own records. The options available are Comma Separated (.csv), XML (.xml), MS Excel Workbook (.xls), and Quicken and MS Money (.qif). The data that is exported will reflect whatever is displayed on your Reports page at the time. So to export specific parts of your history, just navigate to that period in your Reports. Also note that only billQ Plus user can export their report data, billQ Free users will need to upgrade to use this feature.
Expense Summaries & Projection Reminders
Also check out how to get some of your Report data emailed to you in the form of reminders by checking out this article about our new feature: Expense Summaries and Projections.
We hope you find these Reports as useful as we do. And feel free to let us know if you have any comments or suggestions. In the next Feature Spotlight, we'll look at Groups.

